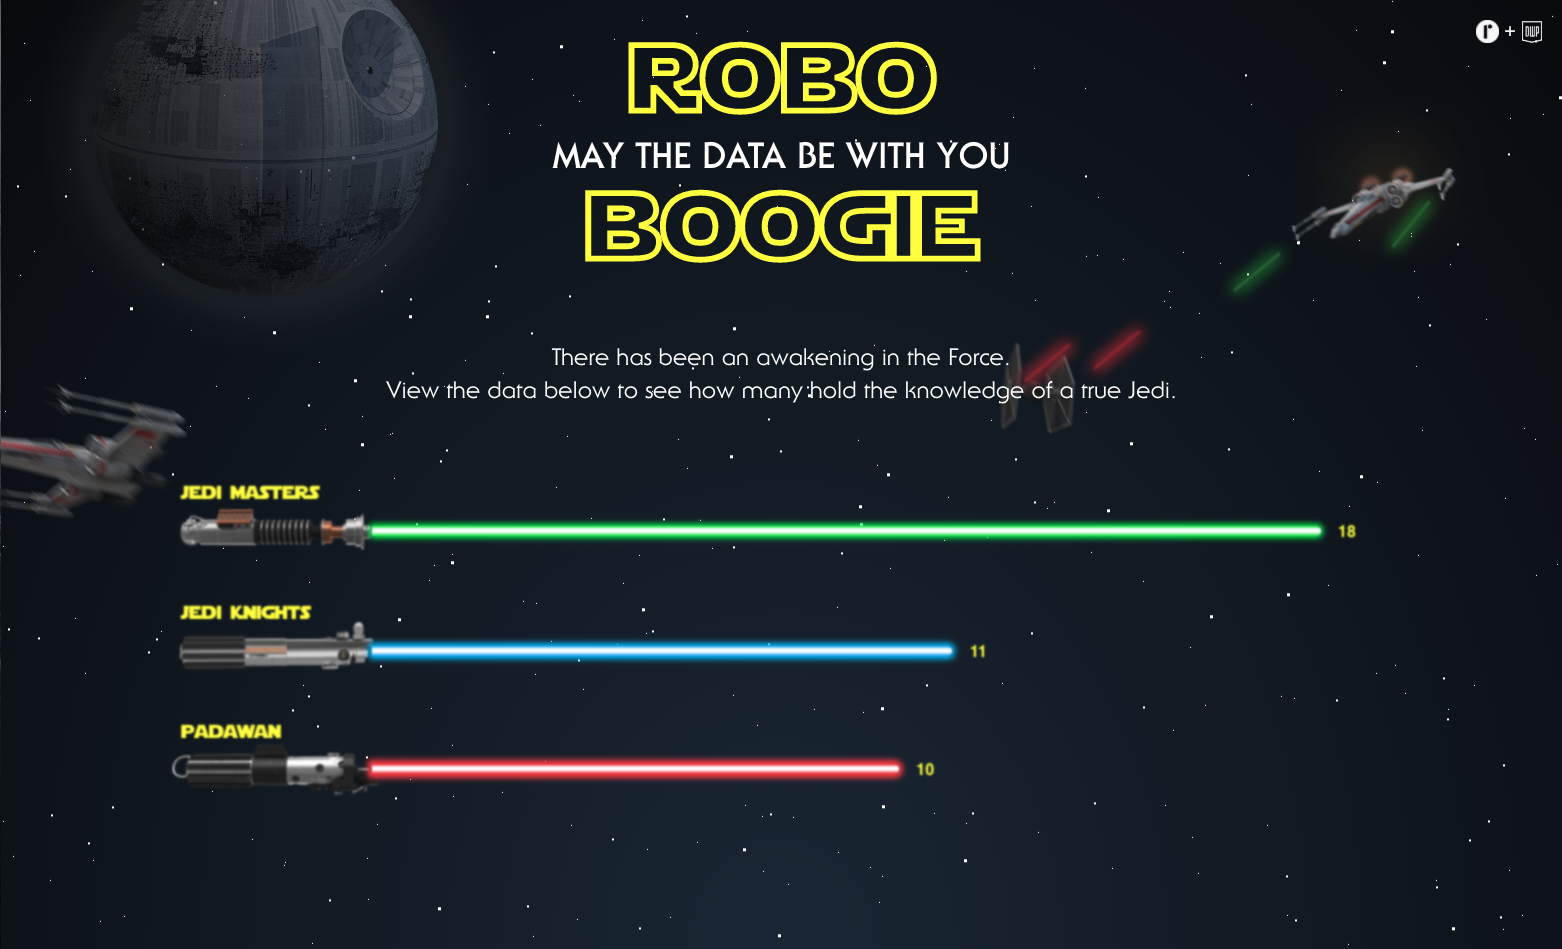
For this installment of our yearly Design Week Portland (DWP) open house, we chose the theme “may the data be with you.” It references two of our favorite things, data and Star Wars. The conversations were flowing, and so were the beverages from our friends over at Widmer Brothers Brewing. If you’re kicking yourself for not coming out to hang with the roboboogie team, don’t fret this is the recap you are looking for!
Guests were fortunate to not only be greeted by a smiling roboboogie employee, but also with a custom Star Wars trivia test to see where the real Jedi Master’s were hiding in Portland. We have to say, our team was thoroughly impressed with the Star Wars fandom in the city with the majority of results being Jedi Master.
We landed on this visual approach of data communication to further display the frequent crossover of data analysis and creativity. Working in the marketing realm, our role is to both delight and engage with customers. When discussing data this is usually best served through a form of visualization. We took a light-hearted approach to your standard bar chart with the shifting sizes of lightsabers instead of your normal layout. Creativity in data visualization can go a long way when you’re looking to explain a dataset. Are you interested to see where you fall on the Jedi spectrum? You can still take the test here, dwp.teamroboboogie.com and view your results at lightsabers.teamroboboogie.com. Be sure to tweet @roboboogiepdx on twitter with your results!
At roboboogie, we’ve fully adopted the “may the data be with you” mindset when tackling our day to day work. We see data as a platform to provide insight into our design decisions. In a very abstract comparison we will compare data insights to the force. In fact, this “very real” quote from Master Kenobi comes to mind, “Well, Data is what gives a Jedi his power. It’s an energy field created by all living things. It surrounds us and penetrates us; it binds the galaxy together.” Pretty nice words from Obi-Wan himself. We have to agree, data binds us all together because it is in fact all of us together making the data.
On an unrelated, but critically important note, is anything not made better by a custom GIF? Check out these incredible GIFs highlighting a few frequent agency dilemmas paired seamlessly with your favorite star wars scenes. We know you’ll especially enjoy these if you work in the industry.
If you missed out on this open house don’t worry! We have another event coming up just around the corner. Our next installment of Camp Optimization will be taking place on May 24th right here in the Washington High building. You can reserve your tickets here.
A big thank you to everyone who came out to Friday’s open house. We love any chance to host Portland’s incredible community of designers and design aficionados.
Experimentation is both an art form and a science. It is a highly creative process that should be informed by (and evolve with) intentional measurement solutions. Starting with just a hunch or educated guess about improving the user experience, and testing the impact of changes can help inform if changes are on the right track. A great way to elevate your analysis and understanding of test performance is by integrating your A/B testing results with a larger analytics solution.
This post will focus on Google Analytics, but there are integrations/solutions to bring your test results into a multitude of systems. The main point is, bring your analytics A/B test results into whatever tool you are using!
1) Keep all your data in one place
A great advantage of bringing in your test analysis to Google Analytics is developing a single point of truth for analysis and data collection. Bringing your data together for a holistic view of all marketing efforts should always be an ideal that your organization strives for. Utilizing a singular system for analysis typically means greater time efficiencies, requires less data manipulation to combine learnings, and allows for deeper insights through a greater amount of data points simultaneously being analyzed.
By sending your test data to your analytics solution, you can segment your test audience by user info such as device, geography, browser and see their full user journey in addition to key performance metrics. You will be building towards a higher level of data sophistication for your organization. Well done!
Just about every testing platform has documentation available to help you with your integration with Google Analytics. For us at roboboogie, that is often the Optimizely X platform. If you are in the same boat, check out this link to get started.
2) Harness all the work you have done previously to set up GA
Most organizations are already tracking with an analytics solution like Google Analytics. This is an easy way to gauge general site performance metrics alongside user demographic and marketing channel performance.
More likely your organization has a lot of events built into your site analytics that you’d like to know the performance of within your test experiment, such as add-to-carts, purchases, total revenue, form submits, video plays, scroll depth, etc. Rather than building these specific performance events into your A/B testing solution and analyzing these metrics in the confines of the A/B testing tool’s reporting tool, simply connect with your larger analytics solution to take advantage of that previously established tracking schema.
NOTE: Google Analytics standard implementation, as well as out-of-the-box CMS e-commerce integrations, are a great start, but to really understand user behavior specific to your digital properties, it’s very helpful to build events to capture user actions and send them to your analytics property. To learn more about building out custom events in Google Analytics, check out this previous post on jumpstarting your behavioral analysis with custom event tracking.
Another advantage of Google Analytics over A/B testing tools is its ability to analyze categorical events in a much simpler manner. The majority of testing platforms are great at analyzing metrics but struggle to capture categorical events in a meaningful way. Sometimes you want to capture a list of string values and compare the inputs. Google Analytics allows this with a function called Event hierarchy (Event Category, Action, Label), whereas most testing tools will only allow us to increment metrics for comparison, not string values.
For an example, it is common for sites that utilize lots of videos on the site to build an event in GA that captures video plays and passes an event with the following hierarchy (‘video’, ‘play’, ‘{{videoName}}’) where {{videoName}} denotes a dynamic value. In an A/B testing tool you would have to build an event for each possible video and increment each time it’s played to track at that level of detail, but in GA it’s one singular event that captures each unique video name and can return a total count of that string value. You can also segment users who viewed multiple videos, specific videos, etc, which would be extremely difficult to analyze in an A/B testing tool. Once again, utilizing Google Analytics makes life easier!
3) Easily compare performance across channels
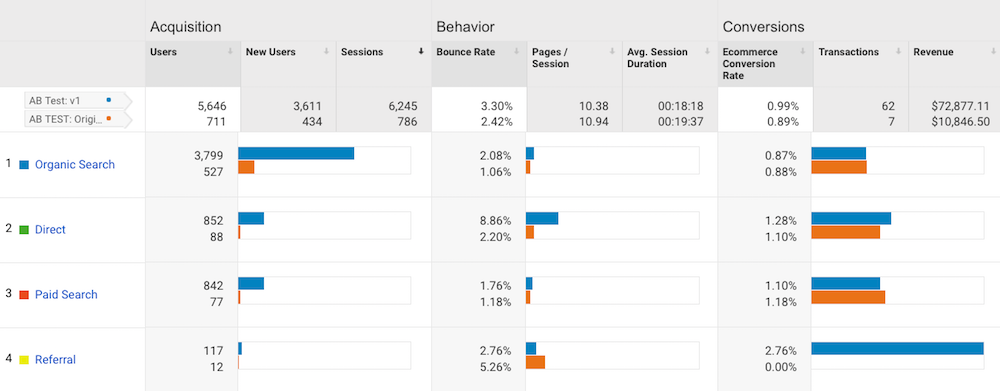
Google Analytics allows for quick comparative analysis across different traffic sources that bring users to our site, and understand trends/performance therein. Applying this to your test audience, you can start to understand if there are underlying differences in performance. For instance, does a user coming via organic search have different trends than someone coming in via social? What about paid search and email? If you’ve spent time mapping your customer journey for your organization, you likely have expectations about what kinds of customers comes to your site, and from which channel. By exploring your test analysis in terms of performance within each channel, you might find that your test performed quite well with a specific channel, and a quite poorly with another channel fueling strategies to begin personalizing experiences for each channel with specific messaging or functionality. Depending on the testing tool you are using, some of this analysis can be done within the platform, but it is much more tedious. Using Google Analytics is quick, easy and easily repeatable for ongoing analysis throughout the lifecycle of an experiment.
4) Analyze highly customized segments
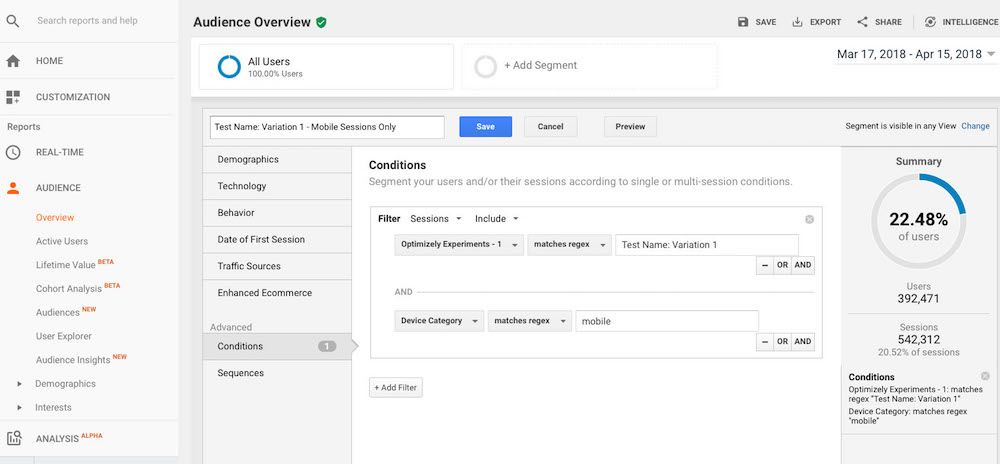
Segments are the real gold of Google Analytics, as it allows you to slice and dice data in very intentional ways. When you know which users were present in our experiments, you can segment by that criteria and a multitude of other criteria such as other unique events your organization has built, user demographic info, device and browser characteristics, engagement with specific pages, and new vs returning user. Multiple conditions can be added together or built out as a linear step-by-step segment (ie. landed on this page, navigated to this page, then converted).
In the realm of A/B/ testing, it is typical to compare specific test variations against one another, which can be accomplished with multiple segments at once. In addition to the test variations, you can add specific criteria such as landing page, browser, device type, ‘saw this explainer video’, etc, which would really hone in on specific audiences to explore and make the standard reports in Google Analytics far more useful.
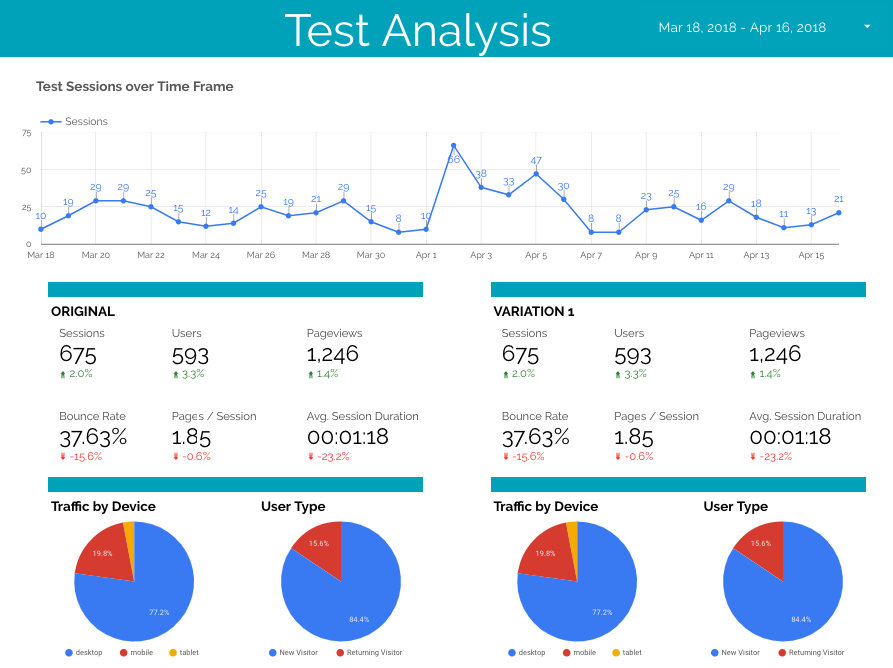
5) Customize and export results reporting with Data Studio
Another great tool from Google, Data Studio allows you to play around with data visualization of custom reports. Now that your experimentation data lives in Google Analytics, you can easily visualize that data alongside your other Google Analytics data to impress your boss and other stakeholders.
Other than Google Analytics, you could also connect other data sources such as Youtube, Facebook, Amazon, a SQL database directly, and all sorts of other data sources via either Google-built connectors or community-built connectors that are available. By bringing in other data sources via the connectors you can build robust and comprehensive reports that will help you holistically analyze your marketing and optimization efforts.
These are just 5 great reasons to pull your experimentation data into your analytics platform. Ultimately, experimentation should bring your organization to changes that drive conversions and improve user experience, and the more robust your learnings, the better.
Need help with implementing measurement or test strategy within your organization? Start a conversation with our team here today and we will help you identify areas of improvement and the action plan to make it happen.
This week we’re talking with Roboboogie Behavioral Analyst, Tyler Hudson. Tyler comes from an analytics background, and loves using data to solve problems for our clients. Curious about how this process works? Read on to get a snapshot of Tyler’s role at Roboboogie, his top picks for exciting trends in the industry, and tips for how to get started with data-backed decision making.
Why did you choose to pursue a career in analytics?
Looking back, I think my decision to pursue a career in analytics stems from a conversation I had with a role model of mine on the future of data analysis and the rapid advancement of the field. It’s a conversation I’ll always remember because it was the driving factor for me to change my degree. Once I switched, I immediately saw the opportunities analytics can provide, and after I researched marketing analysts, I knew this is where I should be.
Working at an agency has allowed me to show clients the applicability of data and its ability to paint a more holistic user picture. My job is very rarely strictly pulling out numbers; that’s the start, but the majority of the work is digesting and interpreting the data in a meaningful way. I’ve always enjoyed searching for the minute details in things that may occasionally be overlooked, and a career in analytics has allowed me to do just that.
How do you approach solving problems with data?
In my opinion, data provides a solid foundation for solving almost any problem. I like to think of data as an opportunity to remove subjectivity from decision making. It’s fundamentally grounding, because no matter what level or rank you are in your organization, if you have the data to support a decision, it’s hard to dispute. That said, it’s important to have deliberate and accurate data collection methods to ensure your team is receiving the most useful information possible. Inaccurate or misleading data can be worse than no data at all.
The real power comes from leveraging the collected data to influence decision making. I’ve found it’s often well-received in a visual format, so after the hard analysis is done for the problem, I then implement a visual presentation. If the visual element is done correctly, it will allow anyone, no matter their experience with data, to understand the information you’re presenting.
What digital analytics trends are you currently most excited about?
Predictive analytics. I’m using this term as a catch-all for a large number of other skills, but in my opinion, predictive analytics is the future of data analysis. The power to accurately predict events is something every marketer wants in their back pocket. However, I do not think it will come to a time where you sit back and let the algorithms go to work. That will be the first step, but there is still a need for analysts to convey the results to a broader team to make impactful decisions. At Roboboogie, we’ve found our niche in leveraging data to guide design decisions, and the results are impressive. Data in itself is compelling, but the real potential is uncovered when you instill data fundamentals across multiple teams.
What is an opinion you have about about the analytics and optimization industry that others might not agree with?
One thing I feel very strongly about is ensuring there is a level of empathy when conducting data analysis, especially when building out machine learning algorithms. It’s a hot topic in the industry, and the timing could not be more important.
At a surface level, empathy and data do not naturally pair together. It’s the classic left brain/right brain argument, and after taking a look at the potential implications of data analysis, the two begin to align more cohesively. There’s a point where leaning on data can divide demographics even more, particularly when AI is being used to analyze data and make predictions. It’s important to remember that behind every single point of data there is a person. I’ve found maintaining this mindset has improved my day-to-day work, and allowed me to take customers into account. At the end of the day, our goal as marketers is to delight and engage with our consumers, and if we are already segmenting them based solely on what the data says our jobs become significantly more challenging.
What advice do you have marketers who are interested in harnessing both quantitative and qualitative data to make decisions?
Dive in and ask questions. This is applicable no matter your level of experience. If you’re early in your career, the best way to learn is by doing. Data science can be daunting with the amount of information available and the rapid advancement of the field. You can learn a new skill every day and still not know everything, but it’s the effort to develop your skill set that is most important.
One skill I’ve recently been working on is developing my qualitative analysis abilities. The insights qualitative analysis can provide are astonishing. When you think about it, the majority of qualitative data is user-generated, so it makes sense to listen and learn from what your customers are directly telling you. The real power comes when both quantitative and qualitative data are taken into account simultaneously. It’s a balance of weighing the sometimes heated reviews, and the overly positive reviews to find the most relevant, intentional data. Adding this analysis skill will give you a holistic view of your most important demographic, your users.
Thanks for letting us pick your brain, Tyler! Want more insights from the Roboboogie team? Stay tuned for our next interview with a Roboboogie pro.
Google Analytics (GA) is one of the most powerful and straightforward tools to quickly start gathering web data on the market. Out-of-the-box GA provides a terrific snap-shot at site performance, but with a little customization you can be getting a lot more out of your implementation to make your analysis more powerful, intentional, and accurate. The customization potential with GA is next to unlimited, but let’s unpackseven simple things you can do to quickly leverage more out of your analytics setup.
(Why seven? The short answer: five isn’t enough, and THE DATA says no one ever sticks around for ten…)
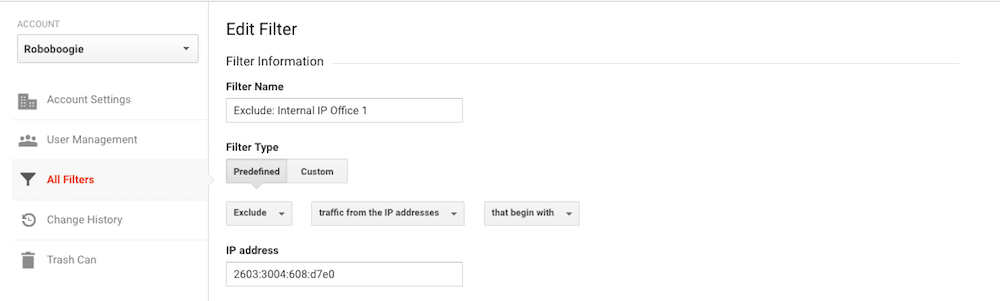
1. Block Your Internal Traffic
The importance of blocking your internal traffic is often overlooked, but take a step back and think “who is visiting my site the most?” Nine times out of ten it’s your internal team. Fortunately, you are able to filter out internal traffic through an IP block. However, this does have a few limitations. This method works best when you have a physical office, but if a majority of your team works remotely then it’s critical to collect your teams individual IP addresses and block them as a unit. It’s a little more tedious, but this is an easy first step to get more out of Google Analytics. Here’s a photo to get you on your way.
After setting up the filter, go ahead and apply it to the properties you analyze the most and you’ll begin to get more accurate customer information passed through Google Analytics.
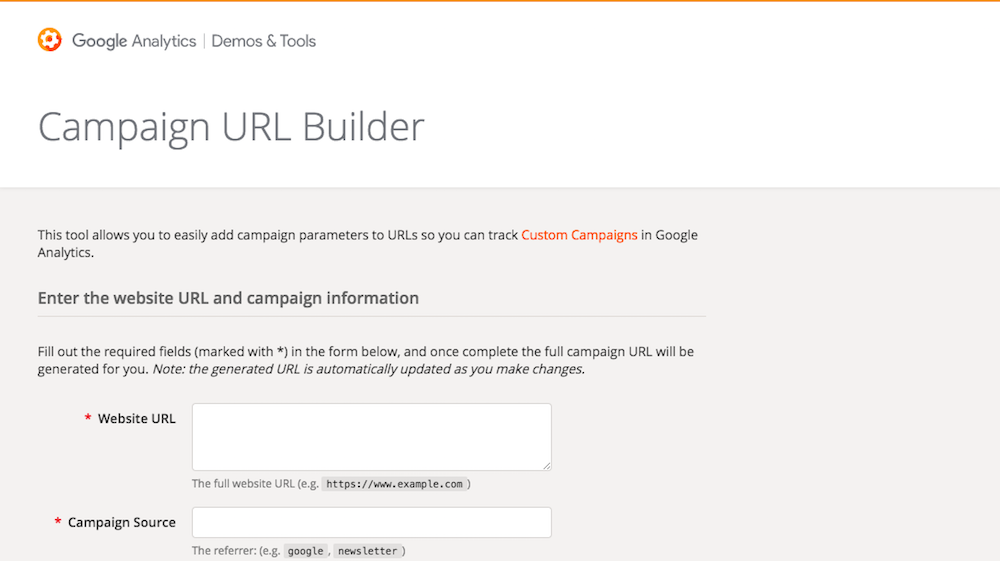
2. Set Up Campaign Tracking
Do you find yourself frequently launching outbound campaigns to drive traffic to your site? Ever wonder if your campaigns are successfully accomplishing your goals? Here’s a simple way to measure the success of your campaigns. Initiate tracking on your campaigns. Implementing tracking for all future campaigns will allow you to see how customers landing from a campaign are interacting with your site. Once activated you’ll be able to dissect the effectiveness of a campaign and iterate on strategies to make your outreach more efficient.
Have a critical funnel on your site? If your website has a purpose, then the answer is yes. You are able to set goals which monitor the effectiveness of your key funnels. Initiating and reporting on goal metrics will begin to uncover any bottlenecked areas on your site. We’ve seen that simply monitoring goals leads to significant increases in conversions. You’re probably thinking, “Just by monitoring? That’s too good to be true!” Well, skeptical reader, the lifts begin to happen once you leverage the data to uncover areas that aren’t resonating efficiently with users.
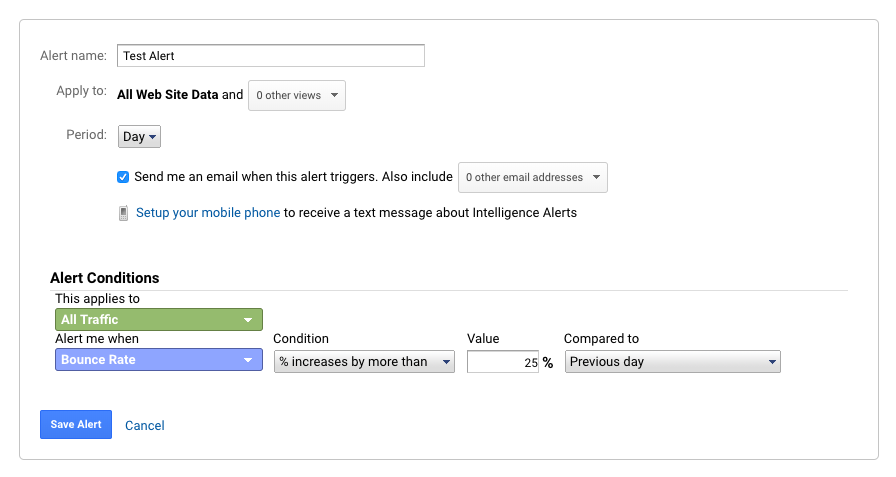
4. Activate Alerts for Key Metrics
This one is as simple as navigating into your settings and selecting custom alerts located underneath the Personal Tools & Assets section. If you have an important metric that you’ve been constantly monitoring, but don’t want to have to navigate into Google Analytics daily, simply set an alert. You can select email alerts or even text message depending on the importance. Activating the alert section will allow you to keep on eye on things without having to be extremely vigilant. Here’s an example alert:
5. Power Your Analysis with Dashboard Creation
Do you find yourself continuously filtering the same customer segments, and then navigating to the same information over and over? Google analytics allows for custom dashboard creation to facilitate this very problem. You are able to get as customized as you’d like, which will save you time if you’ve already narrowed in on your key customer demographic. Or, if you’re looking for a little more insight into your customer journey, reach out. We have extensive experience mapping out both your ideal customer segments and your customer journey through your site.
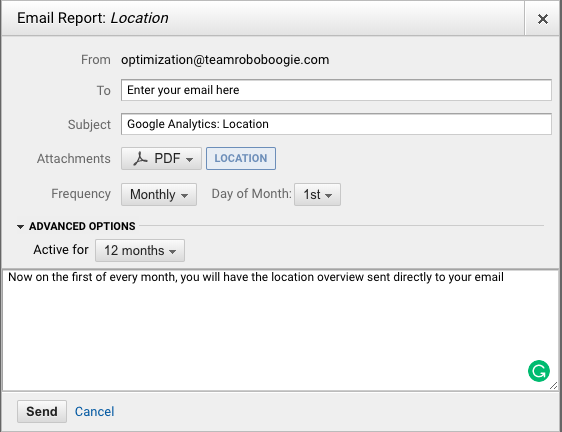
6. Utilize Monthly Email Reports
Would you prefer to never have to go into Google Analytics? While we highly recommend getting more comfortable with it, if this is the case you are able to set up monthly/weekly reports straight to your email. Here are the steps to do so:
Navigate to the report you want
Select ‘Share’
Once modal prompt displays, enter settings and recipient.
Hit ‘send’ and you are off!
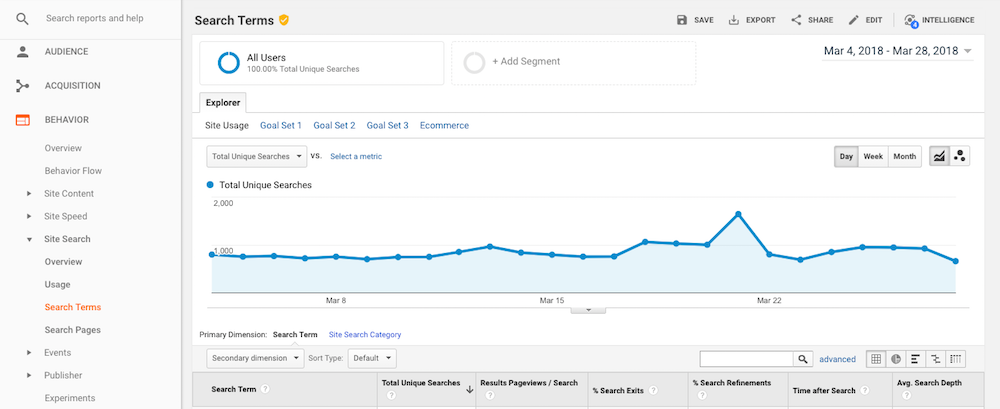
7. Spend Time Getting to Know Your Site Search Results
If you have a search bar on your site, this is critically important and it is easy to find! Simply navigate to the Behavior segment, and site search will be presented to you. Site search is relevant on two fronts because a) it uncovers hard-to-find areas on your site and b) it will show you the most searched for items on the site. These work together seamlessly to paint a better understanding of your users’ onsite interactions. After analyzing this data you can begin to shift the hierarchy of items on your page, likely increasing your conversions.
With these top 7 simple efforts, you will start unlocking more value with Google Analytics, but this only begins to skim the surface of GA’s full capabilities. Check out more of our Analytics posts to uncover more ways to unlock more in your data practices.
There are a multitude of easy, low-lift, implementations to get more out of your current Google Analytics setup. At roboboogie we utilize this tool regularly, and by leveraging it on a daily basis we have been able to adopt a data-backed outlook on design. If you have any questions be sure to reach out, we always love a good conversation on data collection and analysis.