Go Back
What can Google Analytics do for you?
Google Analytics has long been a staple product for businesses to monitor user behavior on their sites, largely due to it’s ease of implementation, collection of easy-to-use standardized reports, dimensions and metrics, AND it’s free. While you can gain valuable insights just from an out-of-box implementation, the foundation of Google Analytics is built upon pageviews and not events, which might not translate to how you’d like to evaluate success on your site. After crafting unique, meaningful, effective digital experiences with proprietary functionality and user interaction functionality, there are gaps between what user behavior scenarios exist and what is measured in GA. However, through the use of custom event tracking, we can understand which content is most compelling to the user, which navigational paths are most utilized, and most importantly, what features or content drive conversions. After layering segments onto this data, such as new vs. returning, mobile vs. desktop, age, gender, etc. we can gain a clearer picture of the customer journey.
Using Event Tracking
Google provides excellent documentation for developers to implement structured event tracking hits on a site or via a tag management solution. As such, this post will not go into detailing the specific hit construction, and will instead focus on some opportunities for event tracking on an sample site.

Need help implementing or customizing your Google Analytics implementation? We’re here to help!
So what qualifies as an event? Really, it can be any user interaction that occurs on your site: a button click, a form submit, a form field being entered, even a mouse-over event if you really wanted to. Generally, we suggest starting by tracking events that capture performance/interest metrics and unique pathing opportunities, as those should most drastically inform your business on user interests and pathing behavior on site, and what drives each unique audience to convert.
A Closer Look
Let’s dive into The New Yorker as an example site to help frame up the best way to approach event tracking in Google Analytics. Although the possibilities are limitless, we will focus on 3 event tracking themes we have found provide the most value: contextual pathing, form submit success/fail events, and a few examples of user interaction that don’t trigger a pageview event.
1. Contextual Pathing
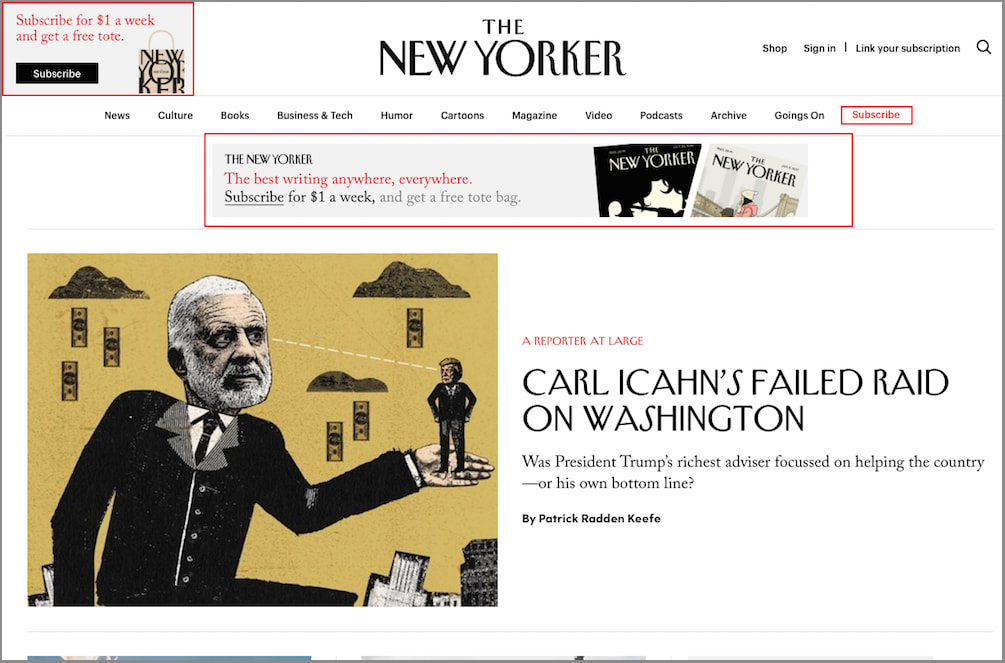
If we look at The New Yorker, we can see a lot of potential user interactions above the fold. A lot of these will land a user at a new page, which would be captured as a page view within Google Analytics. But take for instance the top left “subscribe” CTA, the red “subscribe” CTA in the header nav, and the banner “subscribe” CTA. These all send a user to the same page, so when we’re analyzing page views we wouldn’t know which offer was driving the most traffic. By tracking each unique “subscribe” CTA with an event, we would be able to track the unique user paths for different traffic sources, demographics, devices, etc, and optimize our site experience accordingly. For instance, evaluating performance of a traffic channel (paid search, organic search, email, etc) might help you formulate A/B testing opportunities to either suppress underperforming CTAs or test promote additional paths/content.
2. Form Submit – Success/Fail
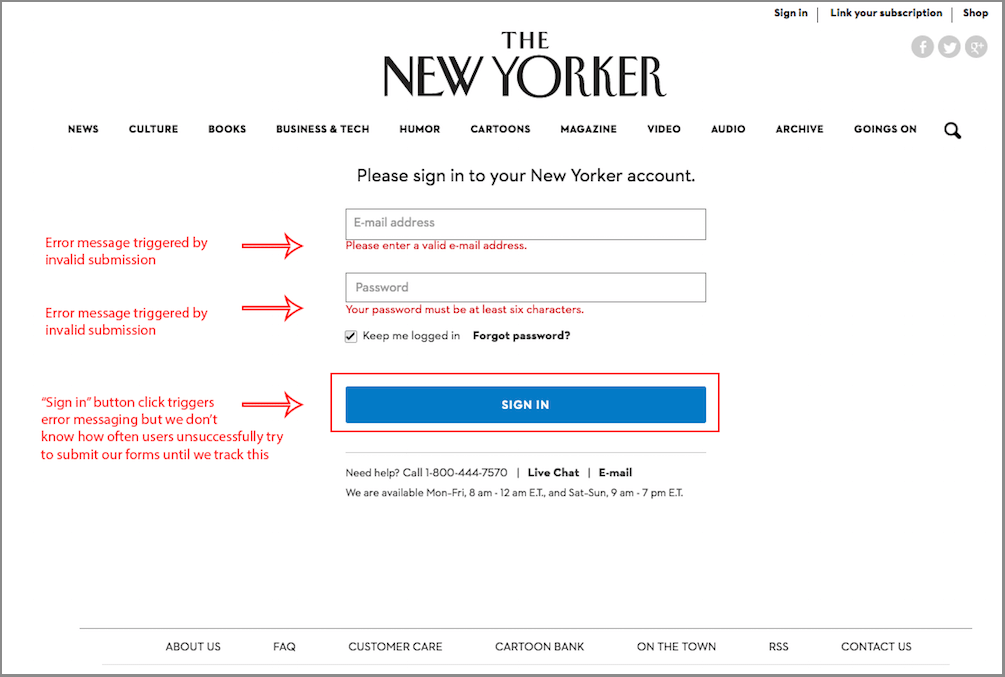
One common user interaction on the website is a sign-in feature to access the full range of content as a subscriber. By clicking the “sign in” CTA in the top right, we’re directed to the account page, and given a form to fill out.
However, let’s say I don’t fill out the form but instead try and submit. The form errors out, but no new page view is fired. Capturing unsuccessful form submits (as well as successful submits) as an event can help an organization triage user experience issues and better understand user flow. Also, capturing form submit successes based on validation of the form versus a “success” pageview also ensures a higher integrity of data, because a thank you page can typically be refreshed or navigated to at a later time, and we wouldn’t want to count these return page views as “successful signups”, given that the form submit didn’t occur simultaneously.
3. Enhanced User Interface Tracking

Event tracking can also apply to things that aren’t necessarily contextual navigation or form submits. For instance, a useful event to understand user behavior on our site could be interactions with the search icon.
Because it doesn’t trigger a pageview when toggled, we don’t know the ratio of users who open the search bar but don’t actually search, which might shed light on some user experience issues.
Scroll tracking can be another useful metric set for long format pages that requires a user to scroll many times before reaching the bottom of the page. You could fire an event as a user scrolls down the page at different milestones (ie. 10%, 20%, 30% etc) in order to track how far users typically make it down certain pages or sections. This could inform design decisions such as contextual navigation, content, and length of page.
In Closing
The key to analytics is intentional data collection. Page views are a great start to understanding the user journey, but events help an organization dissect a user visit in much more detail, giving them the data they need to optimize their site and user experience to convert more visitors into customers. Events help us rank our content by user interest, track performance of forms and offers, better understand user navigation and scroll depth, and ultimately create a better experience that converts.
Stay tuned for our next post in the series “The Importance of Custom Dimensions” coming soon!
Written by: Kelly Burgett
Images sourced from The New Yorker.


